Ohio Fatal Crash Statistics 2021
Posted in Accident & Injury, Car Accident on January 17, 2022
2021 Total Traffic Fatalities in Ohio*
- 1,242
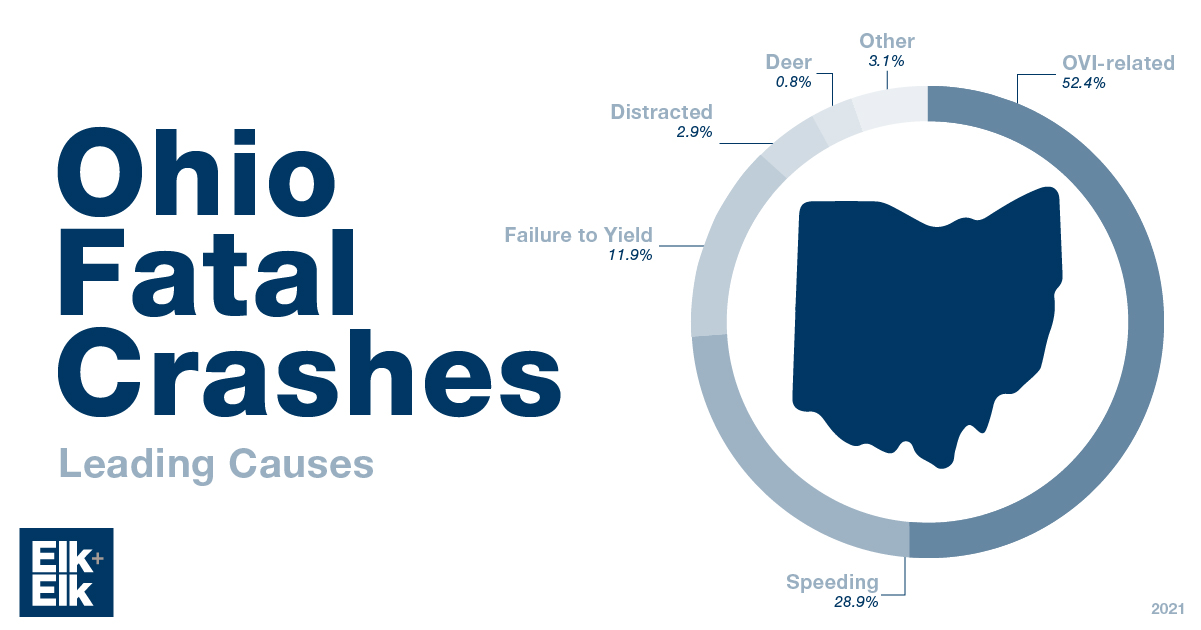
Leading Causes of Fatal Crashes
- OVI-Related: 52.4%
- Speeding: 28.9%
- Failure to Yield: 11.9%
- Distracted: 2.9%
- Deer: 0.9%
Counties with the Most Crash Fatalities
Cuyahoga County had the highest amount of fatal crashes in 2021, followed by Franklin and Hamilton Counties.
- Cuyahoga: 121
- Franklin: 117
- Hamilton: 65
- Montgomery: 61
- Lucas: 53
Fatal Crashes by Hour
Most fatal crashes in Ohio occurred from 6 – 6:59 pm.
- 6 – 6:59 pm: 7.3%
- 9 – 9:59 pm: 6.7%
- 3 – 3:59 pm: 5.8%
Fatal Crashes by Day
Saturday had the highest amount of fatal crashes, with Friday as a close second.
- Saturday: 218
- Friday: 215
- Sunday: 177
- Monday: 166
- Thursday: 162
- Tuesday: 157
- Wednesday: 147
Fatal Crashes by Month
July saw the highest amount of fatal crashes, followed by September and August.
- July: 136
- September: 129
- August: 122
- May: 113
- November: 109
*All statistics were taken from the Ohio State Highway Patrol.