Ohio Drivers are the Worst: Driver Report
Posted in Accident & Injury on January 10, 2020
Quote Wizard, a popular insurance comparison website released its Ohio Driver Report for 2019.
The report goes over the best and worst driving cities, best and worst drivers by age group, most popular vehicles by age group, road and bridge quality, and car insurance rates. A number of sources were used to score Ohio drivers, including insurance quotes from over 100,000 users of QuoteWizard.com, and data from the FHA and the NAIC.
According to the 2018 Annual best and worst driver study, Ohio was ranked the 8th worst driving state, ranking 17th in 2016. If you have recently been injured in an accident, contact our Columbus personal injury lawyers today for a free consultation.
The best and worst driving cities in Ohio
The best and worst drivers were determined by the number of incidents each city had. Incidents include accidents, speeding tickets, DUIs and moving citations.
Top 10 Worst Cities
- Painesville
- Findlay
- Batavia
- Marion
- Elyria
- Bedford
- Barberton
- Sandusky
- Massillon
- Cuyahoga Falls
Top 10 Best Cities
- Portsmouth
- Zanesville
- Toledo
- Youngstown
- Sidney
- Newark
- Piqua
- Wooster
- Euclid
- Fairfield
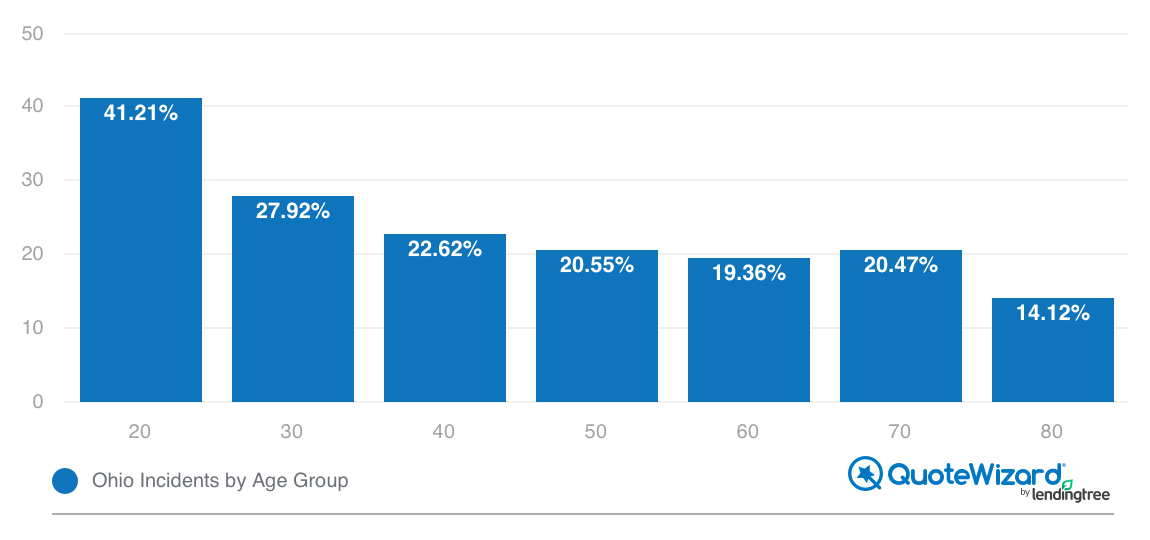
Best to worst drivers by age group ranked
The ranking below is determined by the number of incidents each group had. The 80+ group had the lowest percentage of incidents at 14.12% and the 20 – 29 group had the highest at 41.21%. Below is a chart that shows each age group.
- 80+
- 60 – 69
- 70 – 79
- 50 – 59
- 40 – 49
- 30 – 39
- 20 – 29
The most popular vehicles by age group
Millenials 24 – 39
- Ford Focus
- Ford Fusion
- Honda Civic
- Ford F-150
- Toyota Camry
Gen X 40 – 55
- Ford F-150
- Ford Focus
- Ford Fusion
- Chevy Equinox
- Chevy Malibu
Baby boomers 56 – 76
- Ford F-150
- Ford Focus
- Kia Soul
- Chevy Equinox
- Toyota Camry
Ohio road and bridge quality
According to FHA data, Ohio is the 17th best for overall infrastructure quality. The following factors determined the ranking:
- Roads in poor condition (%): Ohio 18% – Near the national average
- Cost per motorist (due to roads that need repair): Ohio $544 – Near the national average
- Bridges structurally deficient (%): Ohio 6%
Increasing car insurance rates
From 2012 to 2016, there was a 14% increase in car insurance for Ohio drivers. Although there was a 14% increase, it’s still below the national average. Below are the average costs per year:
- 2012: $635
- 2013: $659
- 2014: $683
- 2015: $703
- 2016: $727
What can drivers in Ohio do to improve their rankings – and stay safer on the road?
- Practice defensive driving: Even if you are a safe driver, the person in the lane next to you may not be. This is where defensive driving comes in. Drivers should always pay attention while driving and expect the unexpected: A car changing lanes without signaling or a driver running a red light, for example. Planning for the unexpected can help drivers avoid costly and potentially dangerous collisions.
- Avoid unsafe driving practice: Defensive driving is only possible when you’re avoiding dangerous driving practices yourself. Avoid using your phone while driving – taking calls, sending text messages, using apps or navigating a GPS, for example. Avoid drunk driving: Get an Uber or have a friend drive you home. Additionally, obey the speed limit and other traffic laws. Lastly, respect other drivers on the road. Don’t follow too closely, always use turn signals, and extend the same courtesies to other drivers that you would like to receive yourself.